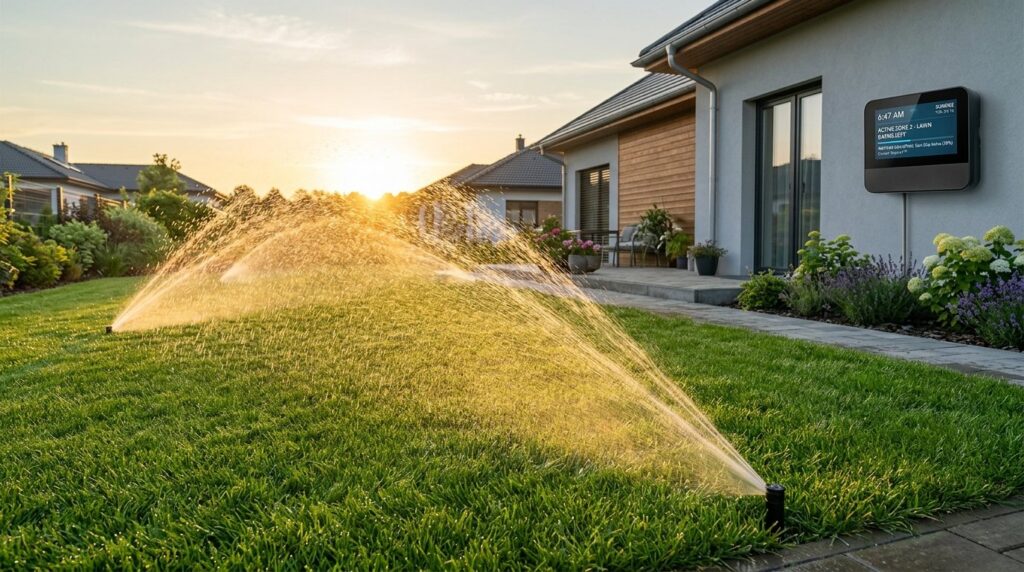
Determining precise sprinkler zone run times requires moving beyond static weekly timers to empirical botanical hydrology. Applying too little irrigation stresses root systems and invites opportunistic weed colonization, while excessive application leaches expensive nitrogen fertilizers into the water table, compacts soil, and fuels fungal blights such as Pythium blight. This reference guide and agronomic computation framework provides the mathematical equations, soil infiltration thresholds, and catch-can audit protocols necessary to calculate zone-by-zone irrigation run times based on reference evapotranspiration (ET0) and lower-quarter distribution uniformity (DUlq).
Interactive Calculator: Zone Run-Time & Evapotranspiration Volume Engine
Landscape managers and homeowners can use the empirical formulas detailed below to compute net irrigation requirements. By calculating zone area in square feet, nozzle application rates in inches per hour, and soil intake capacity, you can eliminate surface runoff and establish optimal cycle-and-soak schedules.
Mathematical Principles of Turfgrass Water Budgeting
Modern botanical water budgeting balances moisture loss from the soil and plant canopy against artificial irrigation and natural rainfall. The foundational metric is Evapotranspiration (ET)—the combined loss of water through soil evaporation and plant transpiration.
Deconstructing the FAO-56 Penman-Monteith Evapotranspiration Model
The internationally standardized metric for atmospheric water demand is Reference Evapotranspiration (ET0), established by the Food and Agriculture Organization (FAO-56) Penman-Monteith equation. ET0 defines the rate of evapotranspiration from an extensive surface of 0.12-meter tall, actively growing, well-watered green grass with an albedo coefficient of 0.23.
The full Penman-Monteith equation accounts for net solar radiation (Rn), soil heat flux (G), mean air temperature (T), wind speed measured at two meters elevation (u2), and vapor pressure deficit (es – ea):
ET0 = [0.408 Δ(Rn - G) + γ (900 / (T + 273)) u2 (es - ea)] / [Δ + γ (1 + 0.34 u2)]
For residential calculations lacking full weather telemetry, the Hargreaves-Samani empirical approximation estimates daily ET0 using temperature extremes and extraterrestrial solar radiation (Ra):
ET0 = 0.0023 × Ra × (Tmean + 17.8) × sqrt(Tmax - Tmin)
In peak midsummer conditions across the transition zone and southern United States, daily ET0 typically ranges from 0.20 to 0.32 inches per day (1.4 to 2.2 inches per week).
Cool-Season vs Warm-Season Crop Coefficients (Kc)
Actual turf water demand (ETc) varies from reference grass according to species physiological traits, root morphology, and stomatal conductance. This adjustment is performed using a crop coefficient (Kc):
ETc = ET0 × Kc
Crop coefficients differ significantly across botanical turf families:
- Cool-Season Turfgrasses (Kentucky Bluegrass, Perennial Ryegrass, Fine Fescue): Exhibit a C3 photosynthetic pathway with higher transpiration rates. Midsummer Kc values range between 0.80 and 0.90. A week with 1.8 inches of ET0 requires 1.44 to 1.62 inches of replacement moisture.
- Tall Fescue (Festuca arundinacea): Features deep root structures (often reaching 24 to 36 inches in uncompacted soils) and maintains a Kc of approximately 0.75 to 0.82.
- Warm-Season Turfgrasses (Bermudagrass, Zoysiagrass, St. Augustinegrass, Centipedegrass): Exhibit an efficient C4 photosynthetic pathway with superior stomatal regulation. Midsummer Kc values range between 0.60 and 0.70. Under the same 1.8-inch ET0 week, hybrid Bermudagrass requires only 1.08 to 1.26 inches of replacement water.
| Turf Species / Cultivar | Metabolic Class | Spring Kc (April–May) | Summer Peak Kc (July–August) | Fall Kc (Sept–October) |
|---|---|---|---|---|
| Kentucky Bluegrass (Poa pratensis) | C3 Cool-Season | 0.75 | 0.88 | 0.72 |
| Perennial Ryegrass (Lolium perenne) | C3 Cool-Season | 0.78 | 0.85 | 0.75 |
| Turf-Type Tall Fescue | C3 Cool-Season | 0.72 | 0.80 | 0.70 |
| Bermudagrass (Cynodon dactylon) | C4 Warm-Season | 0.55 | 0.68 | 0.52 |
| Zoysiagrass (Zoysia japonica) | C4 Warm-Season | 0.52 | 0.65 | 0.50 |
| St. Augustinegrass (Stenotaphrum) | C4 Warm-Season | 0.58 | 0.72 | 0.55 |
Catch-Can Audit Methodology: Measuring Exact Nozzle Precipitation Rates
Manufacturer specification sheets provide theoretical precipitation rates based on factory design pressures (typically 30 PSI for spray heads and 45 PSI for rotary nozzles). However, in-field hydraulic variables—such as dynamic pressure drops across long pipe runs, undersized solenoid valves, nozzle wear, and head spacing irregularities—cause actual application rates to diverge by 20 to 50 percent.
Catch-Can Spacing Grid Protocol and Volume-to-Inches Conversion
To measure the true precipitation rate of an irrigation zone, conduct an Irrigation Association standard catch-can audit:
- Deploy a minimum of 12 to 24 standardized conical catch-cans (or straight-sided flat-bottom cups) across the target zone in an evenly spaced geometric grid (typically 5 to 8 feet apart).
- Operate the zone for an exact runtime of 15 minutes (0.25 hours).
- Measure the water depth collected in each can in millimeters or milliliters. Convert volume measurements to depth using container throat area:
Depth (inches) = Collected Volume (mL) / [Throat Area (sq in) × 16.387]. - Calculate the Gross Precipitation Rate (Pr) in inches per hour:
Pr = (Average Catch Can Depth in inches / Test Duration in minutes) × 60.
Calculating Lower-Quarter Distribution Uniformity (DUlq)
No sprinkler system deposits water completely evenly. Lower-Quarter Distribution Uniformity (DUlq) quantifies system application uniformity by comparing the driest 25 percent of the zone against the overall average:
DUlq = Average Depth of Lowest 25% of Catch Cans / Average Depth of All Catch Cans
Rating benchmarks for residential sprinkler systems:
- Excellent (DUlq > 0.75): High-efficiency rotary nozzles with head-to-head coverage and pressure regulation.
- Acceptable (DUlq 0.55 to 0.70): Standard residential rotor setups with matched precipitation nozzles.
- Poor (DUlq < 0.50): Mismatched spray heads, misaligned arcs, low dynamic pressure, or heads with wind deflection.
To ensure the driest quarter of the lawn receives adequate water without chronic drought stress, calculate the runtime multiplier using the irrigation efficiency equation: Runtime (minutes) = [Net Water Requirement (in) / (Pr × (0.4 + 0.6 × DUlq))] × 60.
Soil Intake Rates, Slope Factors, and Cycle-and-Soak Splitting
Applying water faster than the soil profile can absorb it causes pooling and runoff into street gutters. The basic water intake rate depends heavily on soil texture.
Calculating Maximum Run Duration Before Surface Infiltration Fails
The maximum allowable continuous run duration before surface pooling begins is governed by soil infiltration capacity:
| Soil Textural Class | Basic Intake Rate (in/hr) | Available Water Capacity (in/ft) | Max Continuous Run Time (Spray Nozzles @ 1.5 in/hr) | Max Continuous Run Time (Rotary Nozzles @ 0.6 in/hr) |
|---|---|---|---|---|
| Coarse Sand | 1.50 to 2.50 in/hr | 0.60 to 0.90 in/ft | 35 to 45 minutes | 60+ minutes |
| Sandy Loam | 0.80 to 1.20 in/hr | 1.40 to 1.80 in/ft | 18 to 24 minutes | 40 to 50 minutes |
| Silt Loam | 0.35 to 0.50 in/hr | 2.00 to 2.40 in/ft | 8 to 12 minutes | 20 to 25 minutes |
| Clay Loam / Heavy Clay | 0.10 to 0.20 in/hr | 1.80 to 2.10 in/ft | 4 to 6 minutes | 10 to 14 minutes |
Determining Required Soil Rest Intervals on Sloped Turf
Sloped terrain accelerates surface runoff, requiring a slope reduction factor applied to continuous runtime thresholds:
- 0 to 4% Slope (Flat): 100% of basic infiltration runtime allowed.
- 5 to 8% Slope (Moderate): 80% runtime modifier (multiply allowable time by 0.80).
- 9 to 12% Slope (Steep): 60% runtime modifier.
- > 12% Slope (Extreme): 40% runtime modifier.
If a heavy clay slope requires a total depth of 0.40 inches, and rotary nozzles apply 0.60 in/hr (requiring 40 minutes of total operation), running continuously will cause severe runoff after the first 7 minutes. The cycle-and-soak engine must break this 40-minute total demand into four 10-minute cycles separated by minimum 30-minute soak windows to allow gravitational water percolation.
Programming Calculated Results into Smart Controllers (Rachio, Hydrawise, B-hyve)
Once you calculate your empirical zone parameters, input the data into your smart controller configuration:
- Nozzle Inches Per Hour: Replace default generic presets (“Rotary Head”, “Fixed Spray”) with your empirical catch-can audit figure (e.g., 0.68 in/hr).
- Soil Texture & Available Water Capacity: Assign the exact soil classification determined through laboratory soil texture analysis or jar sedimentation tests.
- Root Depth: Measure your actual root profile using a soil core probe. For mature turf, input 6 inches for bluegrass and 10 to 12 inches for tall fescue.
- Cycle and Soak: Enable automated cycle-and-soak or configure manual pulse times matching your soil’s continuous intake limit. For controller recommendations, read our Rachio 3 vs Hunter Hydrawise Pro-HC review.
Field Audit and Implementation Checklist
Use this field checklist to verify your irrigation calibration every season:
- Conduct a visual inspection of all sprinkler heads during zone operation to check for clogged orifices, sunken bodies, or misaligned arcs.
- Inspect dynamic operating water pressure at the furthest head in each zone using a pitot tube gauge; ensure pressure matches nozzle design specs (30–45 PSI).
- Place catch-cans at regular intervals across each zone and record 15-minute collection depths.
- Calculate gross precipitation rate and distribution uniformity (DUlq) for each zone.
- Extract a four-inch soil core to verify root zone depth and soil textural classification.
- Program calculated precipitation rates and cycle-and-soak durations into your smart controller or digital timer.